Data Analytics & Decision-Making

Everyone's an analyst now

No SQL, no waiting on IT — ask in plain language and get dashboards, charts, insights, and forecasts.

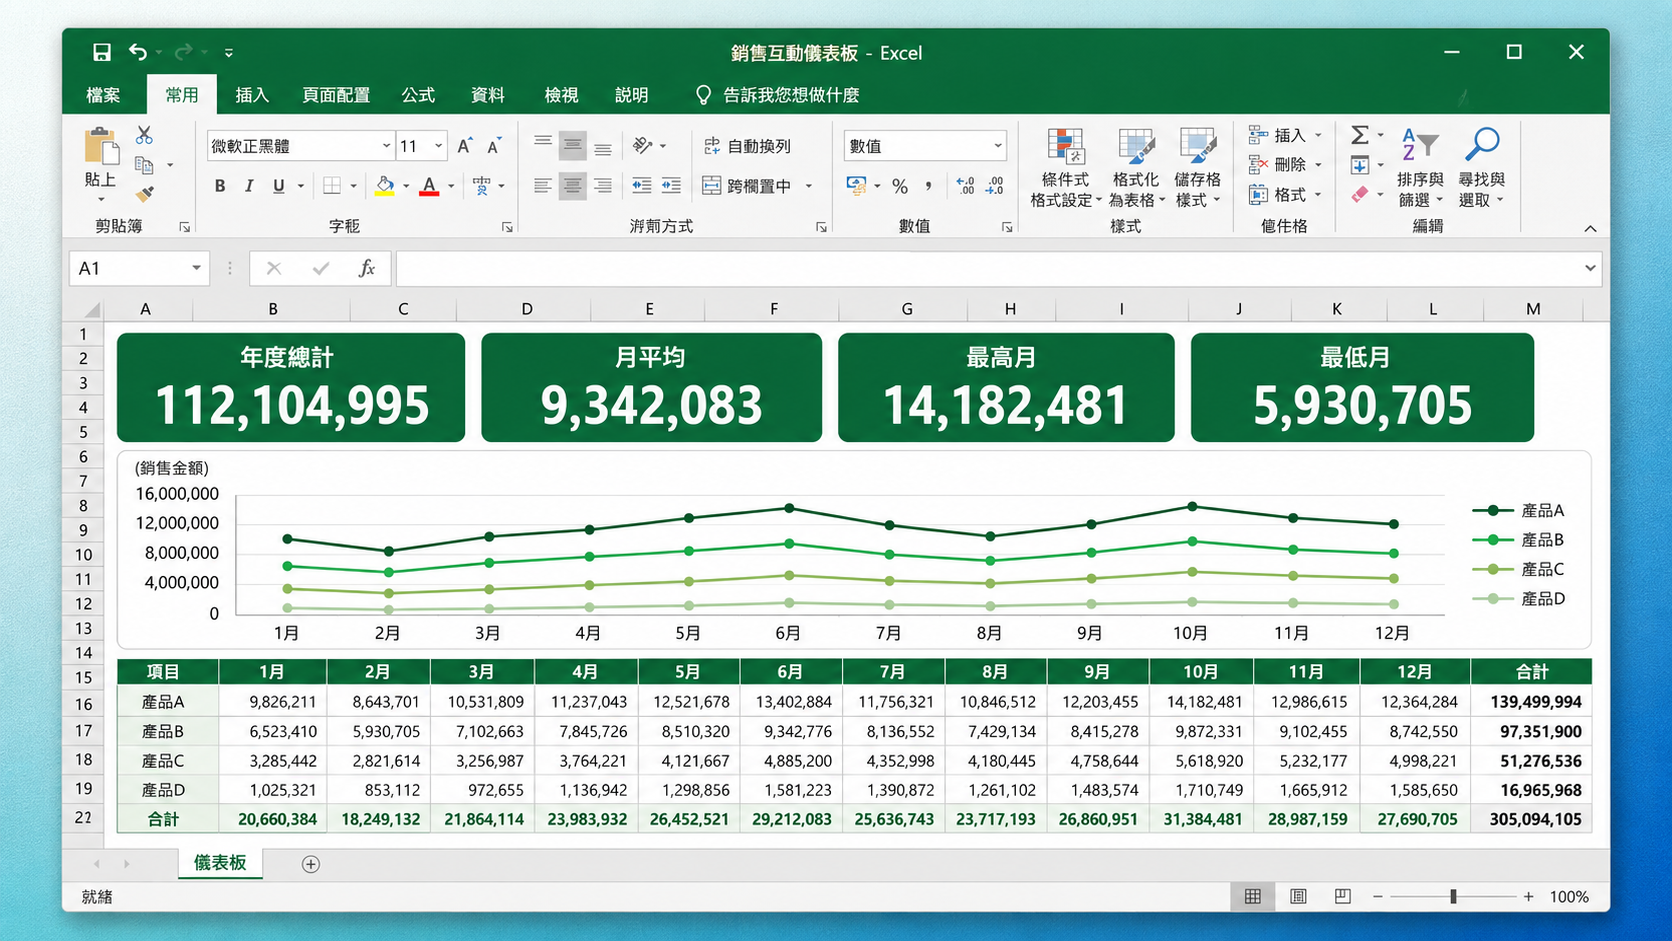
Sales analytics command center — interactive dashboard

Interactive dashboards

Customer, industry, region — slice it any way

Consolidate years of transaction data into a live command center; KPIs recalculate as data updates, and cross-analysis is one click away.

  • Multi-dimensional queries (customer / industry / region)
  • Annual, quarterly, weekly trends
  • Root-cause analysis & predictive models

What it does

Dashboard design

Live KPIs & recalculation

Trends & alerts

Anomaly detection & forecasts

Deep dives

Cross & root-cause analysis

3–5×

faster decisions

no SQL

ask in plain language

self-serve

non-technical teams too

Case studies

Related work

(Sample) Data Analytics & Decision Case
SamplePlaceholder

(Sample) Data Analytics & Decision Case

(Placeholder text — to be replaced) Describe the client's pain point in this pillar.

Book a Consultation for a Similar Case

FAQ

Yes. We help organize it and build the database first, then dashboards and analysis.

Let every team ask and see for themselves